Updated 2 May 2020
This document describes our bench testing procedures. This is a precursor to any testing with production designs or for regulatory application. Due to the need for speed, we jumped directly to porcine models, and then back to the bench. Naturally, this was not the ideal order, but it did help greatly with obtaining support from the clinical community.
Purpose
This bench testing is designed to evaluate a system’s mechanical and electrical stability and durability under a range of load conditions. The mechanical system should be inspected for wear and the software and control system for performance, including timing and correct alarm functions.
The system envelope of operation, or full worst-case use scenario in terms of tidal volume, respiratory rate and I:E ratio can be determined.
This testing will also allow the understanding and identification of potential failure modes and their implications for system operation and patient safety. To avoid biases, this testing should be done with instrumentation that is independent of the system being tested.
Once bench testing is complete the system should be connected to a hospital grade breathing simulator, used for calibration and validating hospital ventilator operation. These simulators are typically found in hospital biomedical departments and simulation centers. We provide information on common brands that we have used.
Breathing Simulator: If the breathing simulator is immediately available with data logging capabilities, this may be used in place of the pressure gauge and spirometer, as it will gather the same data, as well as allow accurate replication of both normal and abnormal lungs and airway conditions, i.e. increased resistance and compliance.
Note: Feedback from regulatory authorities indicate that they will want to see detailed documentation that a team has thought carefully through both the posted safety requirements and their system’s failure modes and demonstrated repeatable flow – volume loops under realistic load conditions.
Test Equipment
| Item | Function / Note |
| Multimeter | Monitors current during cycle Monitors thermocouple |
| Thermocouple, Thermal camera, Thermal gun | Monitor component temperature, including motor, gearbox & motor driver: Flir IR Camera, Fluke 56X |
| Stopwatch & Counter | Used to manually verify system timing. Consulting the pressure or volume trace from the pressure transducer and spirometer or breathing simulator will provide greater fidelity. |
| Pressure Transducer & Data Logger | Monitors pressure profile in breathing circuit throughout cycle Example: Vernier Go Direct® Gas Pressure Sensor, LabQuest 2, Logger Pro Note: these are for bench use only, not clinical testing; for the please use a calibrated breathing simulator. |
| Spirometer | Records airflow and tidal volume Example: Vernier Spirometer |
| Video / Digital camera | Used to record test sequences, including sounds and specific observations |
| White sheet | Used to collect particles / debris under mechanical device and facilitate photographing |
| Breathing Simulator | These are hospital grade systems used to validate ventilator operation Example: Fluke Biomedical Gas Flow Analyzer / Ventilator Tester used in conjunction with a Michigan Instruments Lung Simulator or an IngMar 5000, which allows all parameters to be read directly. Note: Due to COVID-19 these producers are backlogged, it is recommended to look to local clinical facilities for immediate availability. |
Setup
During this test a manual resuscitator bag was placed into the Emergency Ventilator and operated under a specific set of test conditions, including tidal volume (V), I:E ratio and respiratory rate (RR). We focused on evaluating the performance of the bag and its valves, as well as monitoring mechanical and electrical components.
Note: The test setup is shown in Figure 1, with a Version 2 system. Testing is ongoing with Version 3 and the most recent code.
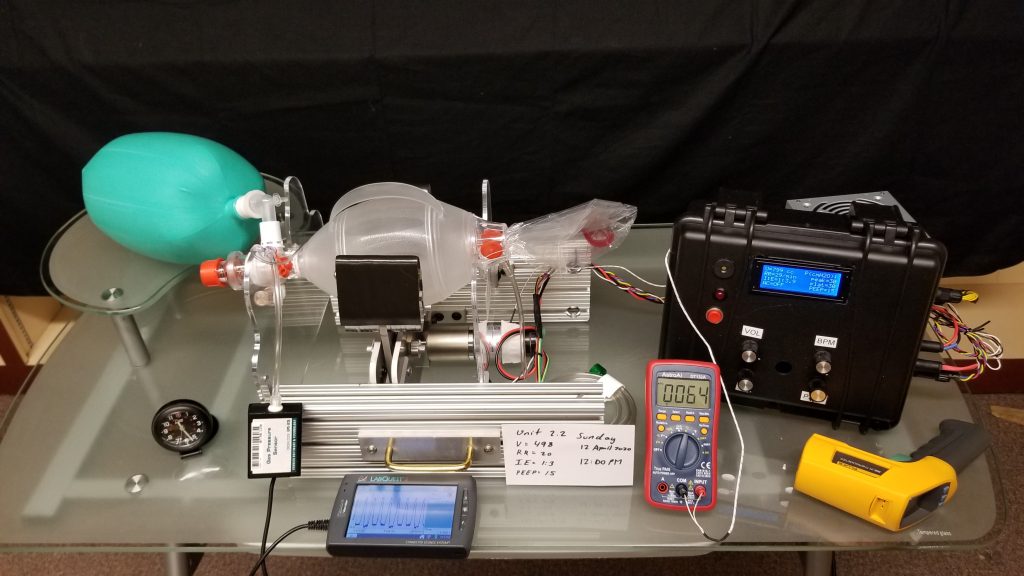
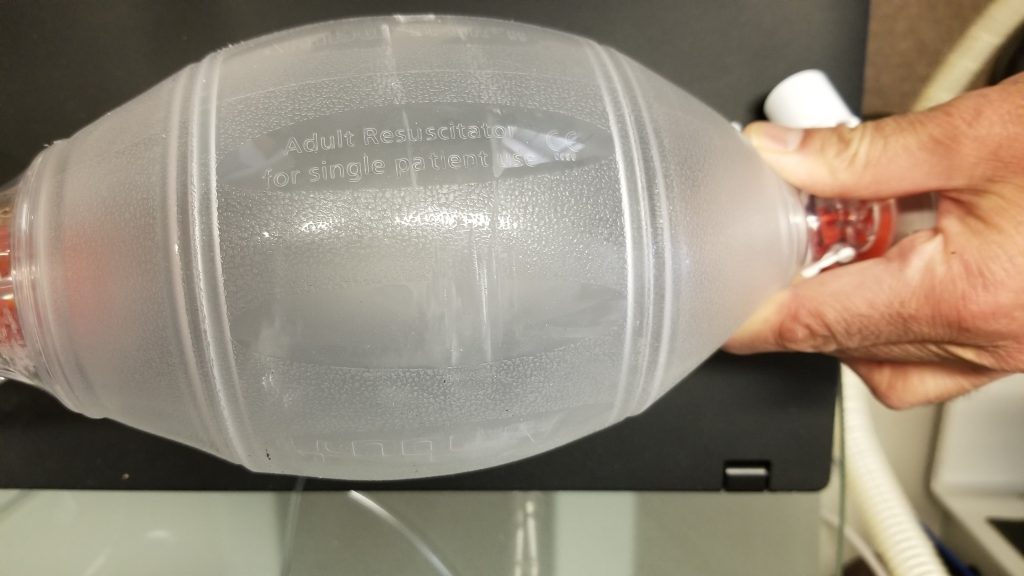
The system is shown with a new disposable Ambu Spur II bag installed and the supports adjusted so that the bag was centered vertically and horizontally. Note that this is a single use bag and, thus, expected to wear out sooner than the sterilizable Ambu Oval Silicone Resuscitator and similar bags. The bag was deliberately not secured, other than placing it in the mounts, in order to observe whether it would experience forces that would cause it to move. Because of sharp edges on the prototyped arms, a result of stacked laser cut parts, they were covered with 1/16” adhesive polyethylene foam.
A green anesthesia bag was connected to the bag’s outlet and the pressure transducer to the bag’s luer lock port via a Y connector, allowing for an independent reading and plot of the pressures displayed by the system. A PEEP valve was installed in the standard position on the bag. The tape placed on the motor to serve as a non-reflective target for the thermal gun and also secured the thermocouple. The multimeter was connected in series with the motor’s positive lead, to measure the motor current, and later a thermocouple was plugged in to compliment the thermal gun and camera. The pressure line is attached in parallel with the control system’s pressure line
Note: The elastic anesthesia bag only partially models human lung compliance. This is expressed as cmH2O per mL of volume delivered, i.e. a balloon becomes harder to inflate as more volume is delivered. Typical compliances ranges for COVID-19: 15 – 50 mL/cmH2O.
Typical resistance ranges for COVID-19: 5 – 20 cmH2O/(L/s)
For this test the anesthesia bag was not loaded, but weights could be placed on it to increase loading for a functional test. As an example, with an estimated bag surface area of 100 cm2 (when flattened) placing a flat load on top of 5 kg will approximately simulate 40 cmH2O. Note that this is a constant pressure, not a true compliance, and the resistance is not adjustable, as is possible with a breathing simulator, but it will increase the stress on the mechanical and electrical components for testing purposes.
24 Hour Bag Durability Test
System operation was begun at 1200 on 12 April 2020 with the system set to the following parameters: V = 498 mL, RR = 20 BPM, I:E = 1:3. We observed the following pressures: PIP = 26 cmH20, Plateau = 26 cmH20 from the display. The PEEP value was adjusted until the display indicated 15 cmH20. An ambient temperature of 23.5°C was observed.
Periodic observations were made of the system until 8:30 PM. During the afternoon the motor temperature rose and stabilized at 30.3°C. At 1:15 PM a maximum of 33.0°C was observed on the motor casing, was attributed to a corresponding rise in room temperature. The system was left operating overnight.
Because the anesthesia bag and circuit does not simulate resistance, PIP and plateau pressures were observed to be the same values. In general, PIP should be higher than plateau under volume control ventilation. Slight drops in both were observed and by 9:30 AM on 13 April 2020 both were 23 cmH20. This might be attributed to slight wear of the valves, minor sensor drift or something else. The current was observed to not exceed 5 A at 12 V on the maximum inwards position, which showed that the system was operating in specification.
The system remained operational and at 1200 (midday) on the 13 April 2020, after 24 hours, the test was completed. After an approximate total of: 28,800 cycles the bag was inspected for wear, though light scuffing was visible. The bag was observed to rebound fully during each expiratory cycle and the valves opened and closed correctly. The bag had not changed position, which indicated that it was not experiencing any significant torqueing. Total cycles were estimated at under 28,000 compressions.
Shakedown Test
This allowed us to identify issues related to timing and position control, which we expect have been corrected in the most recent release. This is presented to emphasize why bench testing is essential!
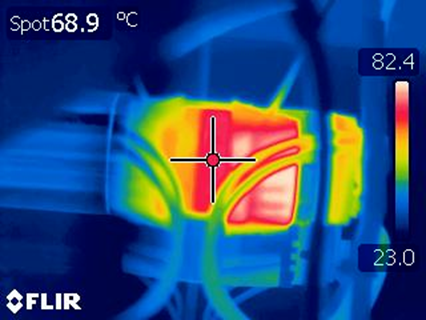
System testing now continued more aggressive TV, I:E and RR settings closer to the system maximums. At this point a high temperature condition was identified with the thermal gun, thermocouple and thermal camera, shown in Figure 2, with an external motor temperature of 70° C, while the gearbox maintained unremarkable temperatures. The in line Ammeter allowed us to identify that the current spiked momentarily to 12 A at the inside of the stroke.
This allowed the issue to be diagnosed: Due to an error affecting commanded position, the arms were closing to the point that the bag was fully compressed (pancaked) and, unable to move further and, hence, the position control was increasing its PWM duty cycle to no avail. With adjustment of parameters, the motor cooled down and continued to operate reliably.
Separately, the arms were observed to also have an inwards position drift, i.e. the maximum commanded extended position had decreased. This resolved when the system was power cycled and, thus rehomed. Subtle errors of this type only show up in longer term testing.
Using the Vernier pressure sensor connected to the Y we were able to validate that the displayed values of PIP, Plateau and PEEP were within 1 – 2 cmH2O of the actual values. Furthermore, this pressure sensor provided a means to rapidly plot the cycle and examine timing.
When needed, timing can quickly be checked using a stopwatch and a counter. Doing this allowed us to identify a timing issue that did not accurately account for the motor ramp up to slew velocity. When set at above 30 BPM the actual respiratory rate was observed to be a few cycle less. This is discussed further in Waveform Testing.
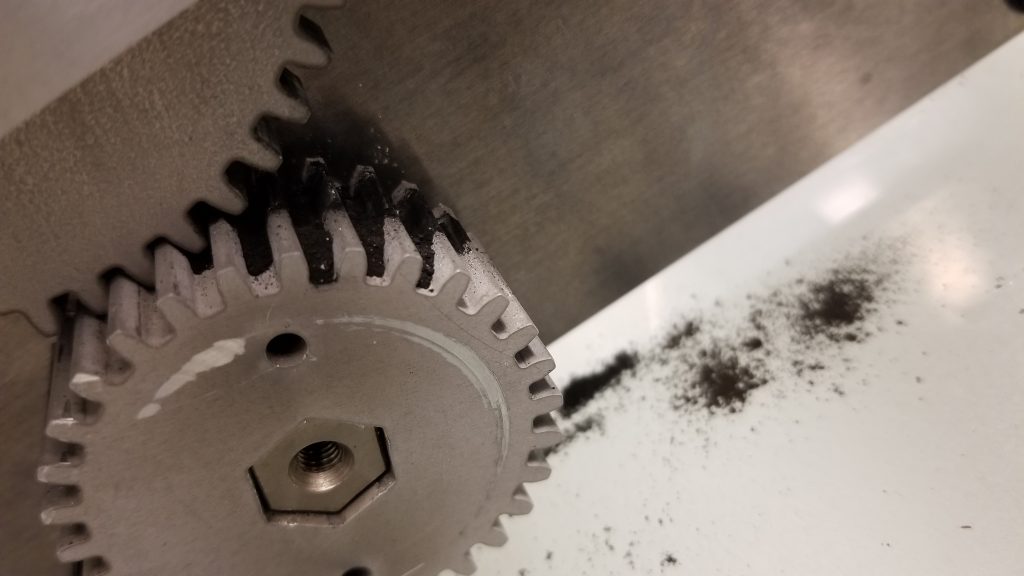
After at least another 18,000 cycles the system was shut off for the night. This allowed for another, albeit unplanned test: The next morning the bag, which had been left in the clamped position, was observed to no longer rebound and therefore not be able to reliably deliver the commanded tidal volume. Another 12 hour day of various cycles were conducted and the bag was again inspected and significant wear observed. The prototype materials of stainless steel arms and the aluminium pinion did not fail, but they did generate significant wear particles, as expected. See the design spreadsheet in Downloads showing why steel is a correct material choice. A white sheet placed underneath a mechanical system allows for easy monitoring of wear.
Waveform Test
Specific to detecting timing issues, it is critical to conduct a sweep that comprises multiple RR, I:E and tidal volumes, with either a spirometer or a pressure transducer (and ideally both) connected and data logged for examination. This sweep was conducted on Unit 3.1-005, running software that has now been updated, with RR was increased in increments of 5 from 10 – 40 BPM for I:E ratios of 1:1, 1:2, 1:3 and 1:4, while the requested volume was left at 600 mL. Pressure data logged during each with the Vernier transducer and logger.
The MATLAB script used for this analysis generated and “ideal” pulse train based on I:E and RR. It ignores the first pulse then synchronizes the train it with the first cycle of the measured data and then generates the pulses from there, without further synchronization. This way out of sync cycles can be detected by inspection. Two sample plots, Figures 5 & 6, are shown.
Note: The breathing simulator will plot and save data as well as report RR, I:E and volumes numerical values that can be compared to setpoints.
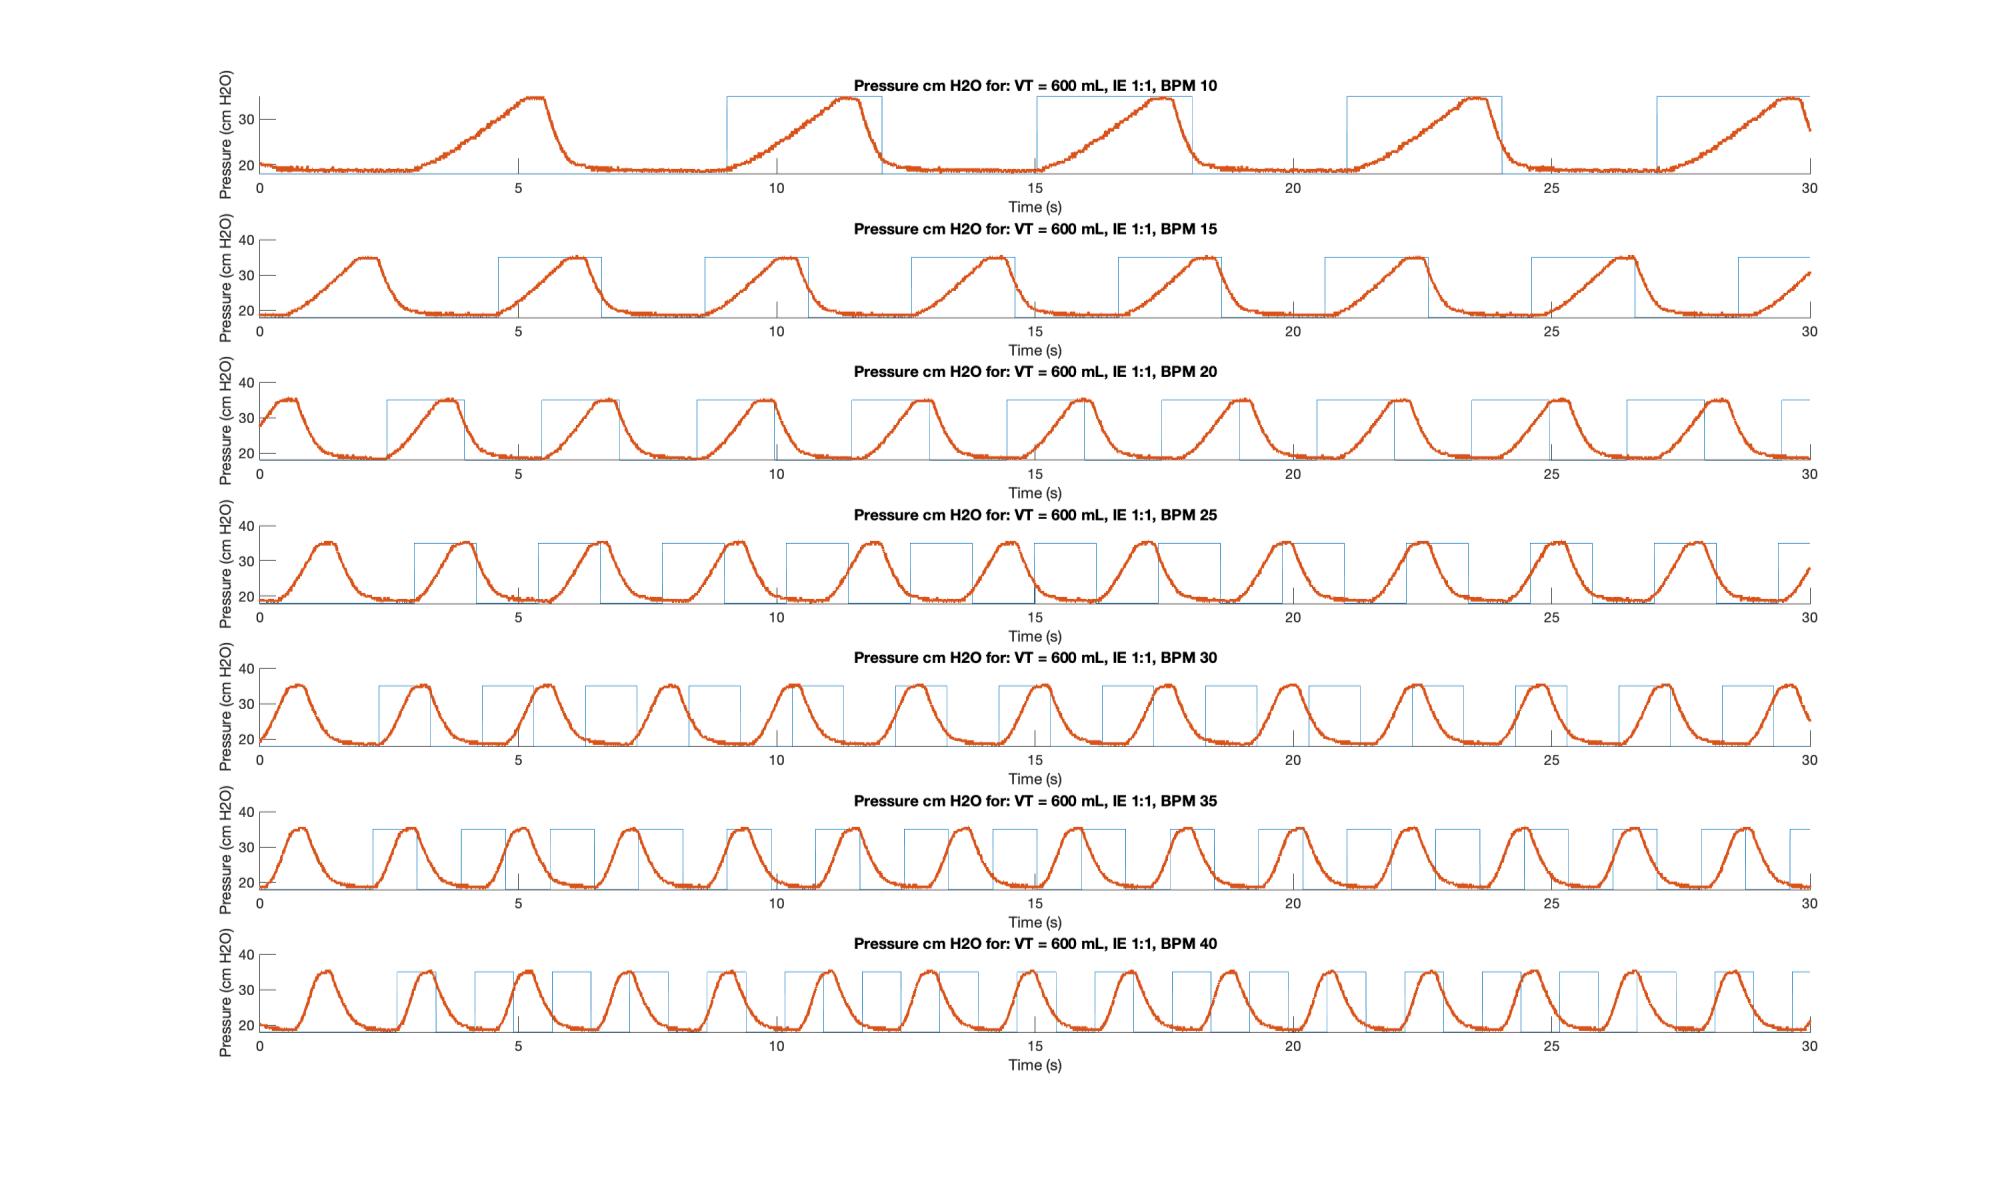
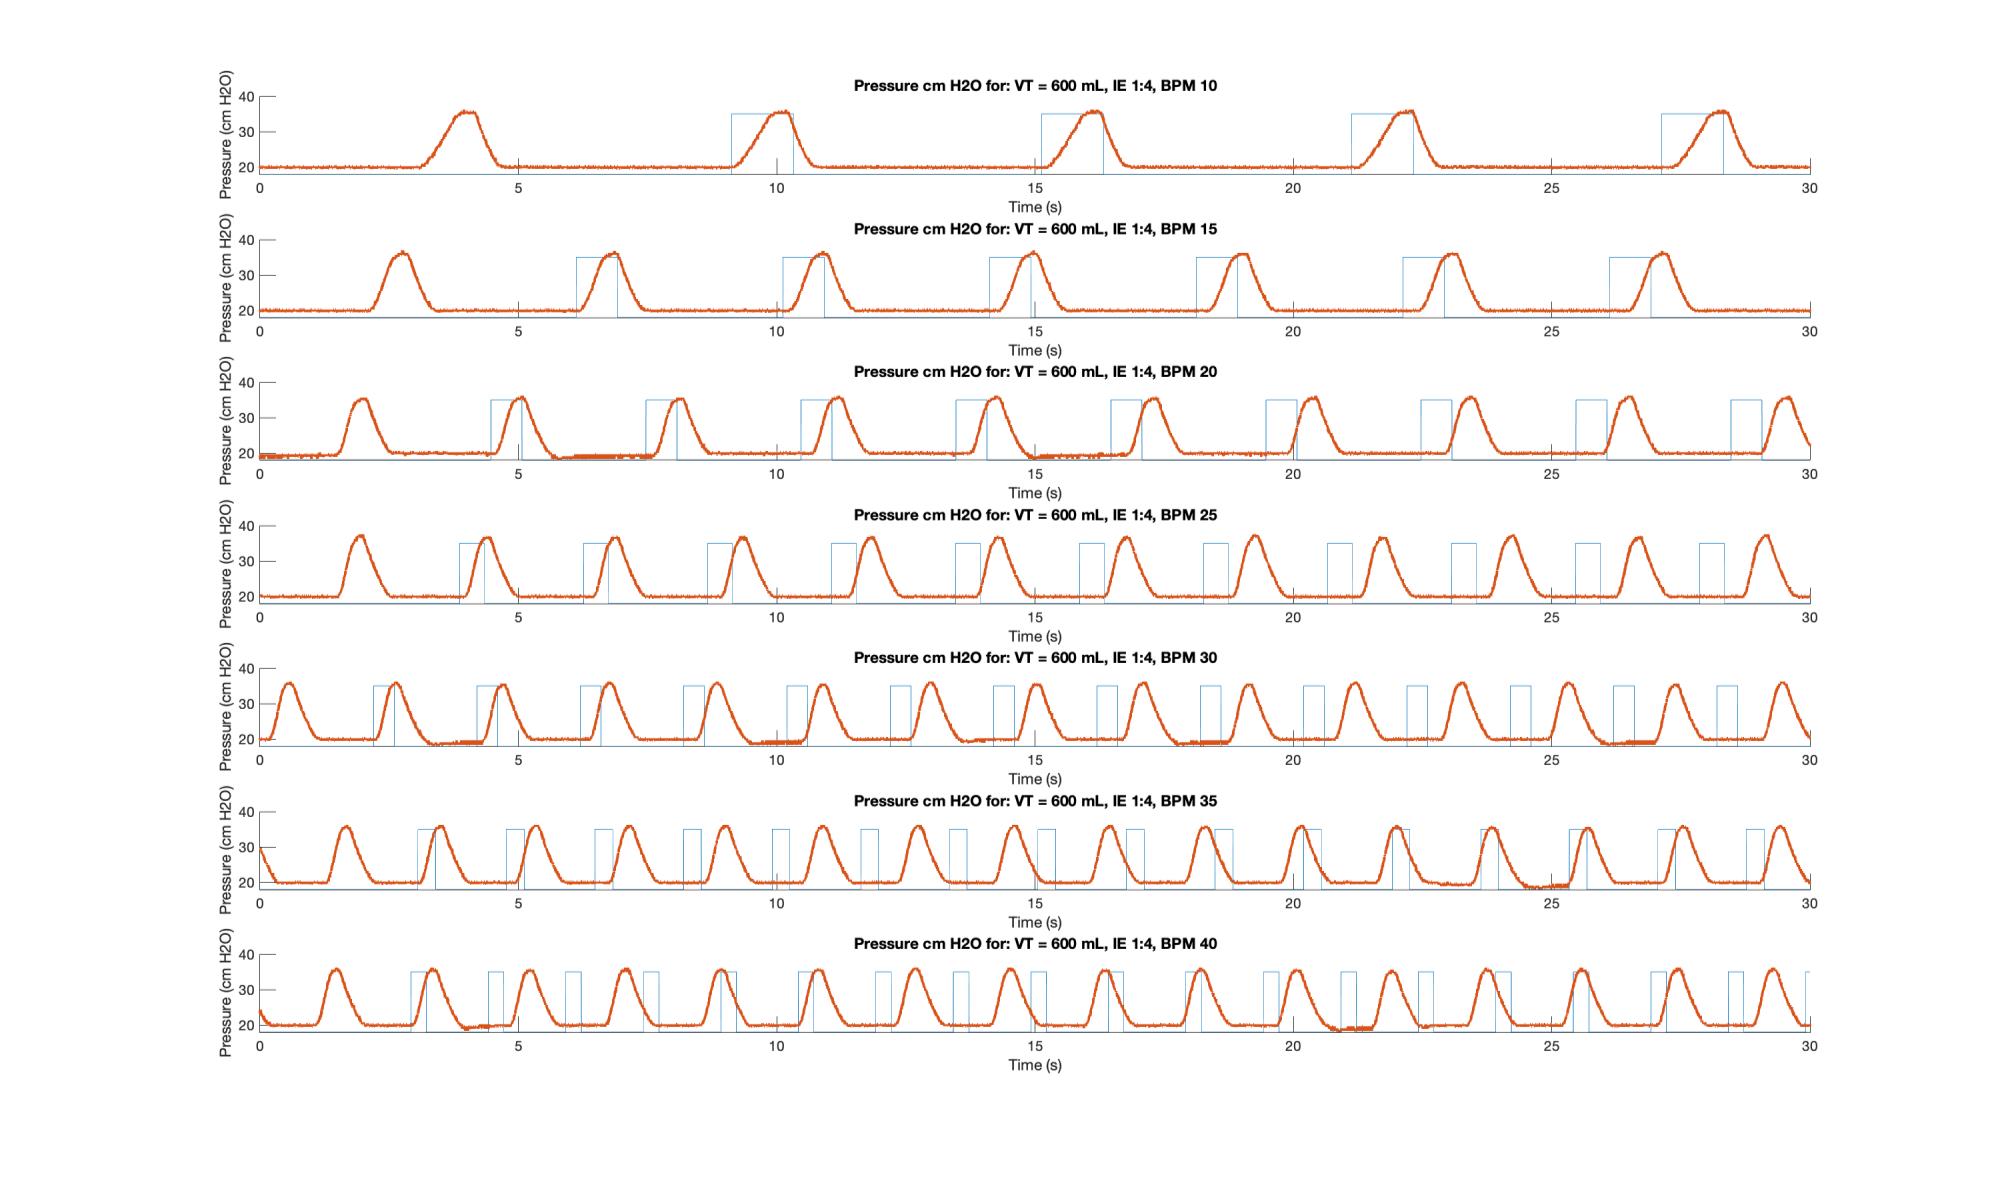
The inhalation under velocity control arm motion is indicated by the upwards slope; the small plateau is the 0.1 s pause during which the plateau pressure is measured and displayed; the downward slope represents the exhalation and is governed by the fluid mechanics of the bag and breathing circuit; and the lower dwell is the time during which PEEP pressure is measured. As per the code, the inspiration time (I) should be the sum of the time of the upward slope plus the pause, while the exhalation time (E) should be the sum of the downward slope and the lower plateau. Because the anesthesia bag and circuit does not simulate airway resistance, which leads to a backpressure during airflow, PIP and Plateau pressures should not be substantially different. In general, PIP should be higher than plateau under volume control ventilation.
On the plots the upper plateau can be seen to be relatively consistent across I:E ratios, but it becomes slightly more “pinched” as a function of increasing RR. In general, as RR and I:E increased the system suffered delays. For I:E of 1:3 and above RR is increased the system is unable to move at the desired inspiration speed. This was traced to unaccounted for motor ramp up time and has led to improvements to the motor controller design.
Discussion
- We are confident that an Ambu Spur II will have a minimum 24 hour life without catastrophic failure of the bag or degradation of the valves. Using a more resilient bag, such as the Oval Silicone Resuscitator is expected to have a significantly longer life and rotating the bag periodically, to distribute the stresses will further increase life.
- The need to use steel gears, preferably hardened, is confirmed, and we suggest a way to conduct continuous system testing.
- We present a means to independently test the system controls and electronics. This is important to identify issues with timing and the pressures resulting from motion against various loadings.
- All systems should be further checked for timing and stability at a range of values, that represent the extents of system operation.
- It is important to note that some “worst case” combinations of parameters, which will stress a system, are unlikely to occur in a clinical scenario, i.e. delivering 800 mL 40 times a minute at a I:E ratio of 1:4. More sophisticated UI/UX strategies can seek to exclude some combinations.
Conclusions
The purpose of this bench testing is to easily and rapidly identify potential issues with the control system. It will also allow the envelope of maximum system performance to be determined by inspection. This should be formalized in a system qualification procedure for shipped devices. Similar testing can be done to investigate minute volume using the spirometer connected to the manual resuscitator. Using a breathing simulator allows for more realistic compliances and resistances to be applied and system performance recorded.

Thanks for sharing this, I am from University of The South Pacific and we are currently working on a similar design for emergency ventilators for use in Fiji. This will help us in our project. Thanks once again.
Hi guys, Thank you for sharing the information. I just wonder…. why in previous versions to 3.1, the concave side of the fingers was pointing towards the bag and now in version 3.1 is otherwise? I was looking for a answer through the site but did not find it.
Sorry for the slow reply, the idea with V2 was to grip the bag like cupped hands, but the V3 goal became to just compress smoothly and completely. (We have made all sorts of prototypes.)
Thanks for sharing, in San Juan Argentina we worked with 3 engineers from the national university of San Juan and two bioengineers from the Rawson Hospital, our biggest challenge was in the torque and mechanism speeds for maximum tidal volumes and I: E 1: 4 1: 5. To get to the final prototype we also went through 3 prototypes, it works, with a stepper motor and an infrared end switch that allows re-synchronization cycle to cycle, a small graphic display for the pressure graph, and setting parameters now our prototype is in testing phase by local health agency, we await your approval to manufacture in series
Hello Hector,
I am also using a stepper motor and re-sync it every cycle.
What is the torque of your stepper motor? I am using a 19Kgf and a 10:1 gearbox, but I can’t get to 30cmh20 in 800ml.
We have seem some experimentation with steppers and you are correct, re-homing every cycle is essential! Please share with su your approval and testing results.
i need which material use of control case and design control case
Can someone please help me figure out what is necessary to make the complete test bench (i.e connecting all pipes, connecting the sensor to patient airway as well as to the bag, etc.) and also what exactly is suppose to be on the SD card on the breakout board? I know this project requires a breakout board to be used with the ATMega, but I’m not sure what exactly to upload onto the SD card that goes in the breakout board. I thank you in advance.
Thanks,
Shudhant